Biodiversity initiatives, mapped — and joined into pollinator highways
For businesses that look after grounds at hundreds of sites: every meadow, hedge and bee hotel is logged against its site, placed on one map of the UK and Ireland, and linked to its neighbours. See the whole estate, one client or one region — and what each site could do next.
One map for the whole estate
Every action, site by site
- Completed work fills a site's marker, planned work shows dashed, and site reports count only once someone has accepted them.
- Filter by client, region, business unit, category and year. The twelve UK regions and the three Regional Assemblies in the Republic of Ireland — each site's region is worked out from where it is.
- Reports for exactly what is in view: branded PDF and Word with a printable map, plus a CSV of every action — for the whole company, one client or one region.
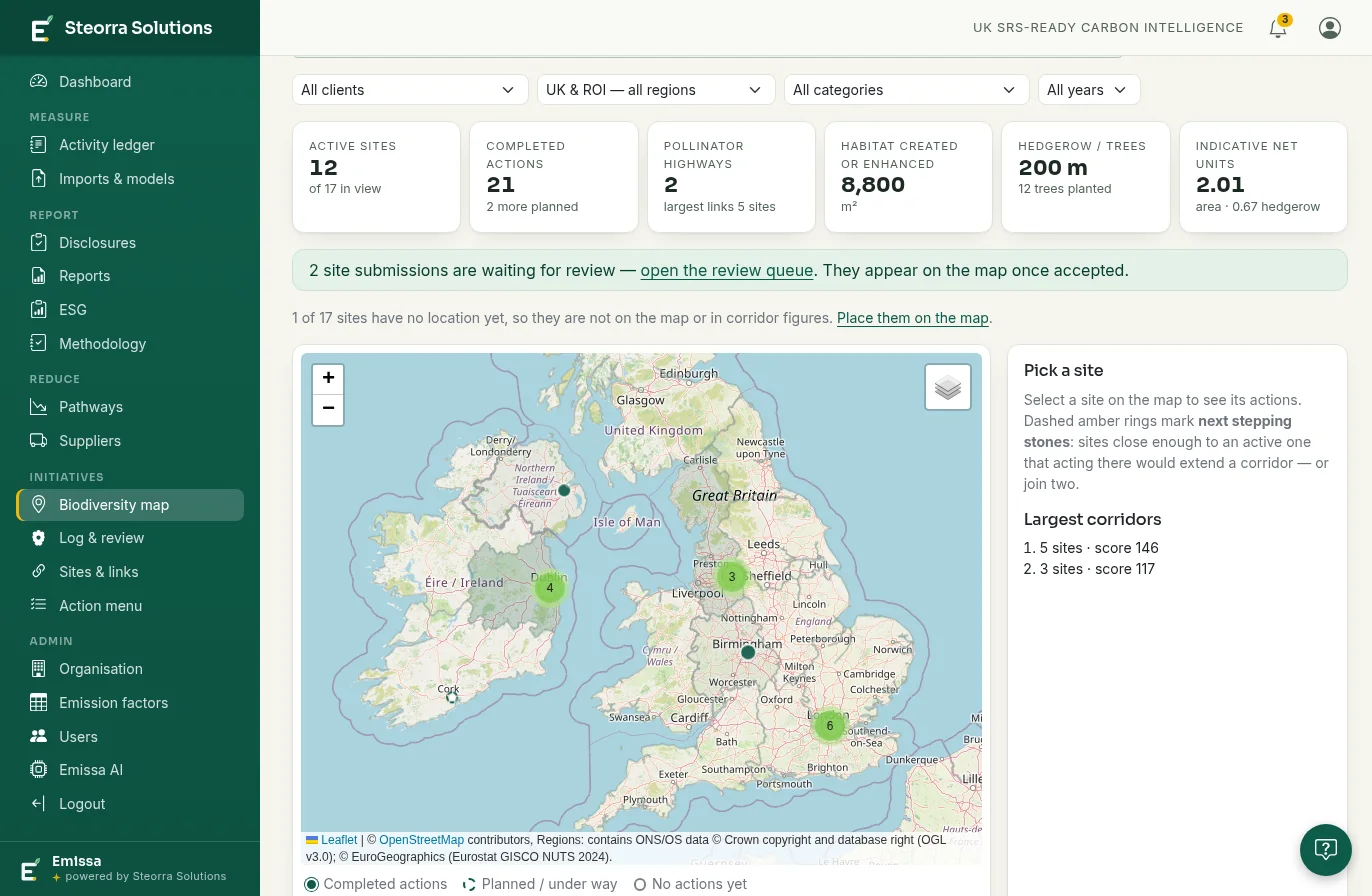
Stepping stones, worked out for you
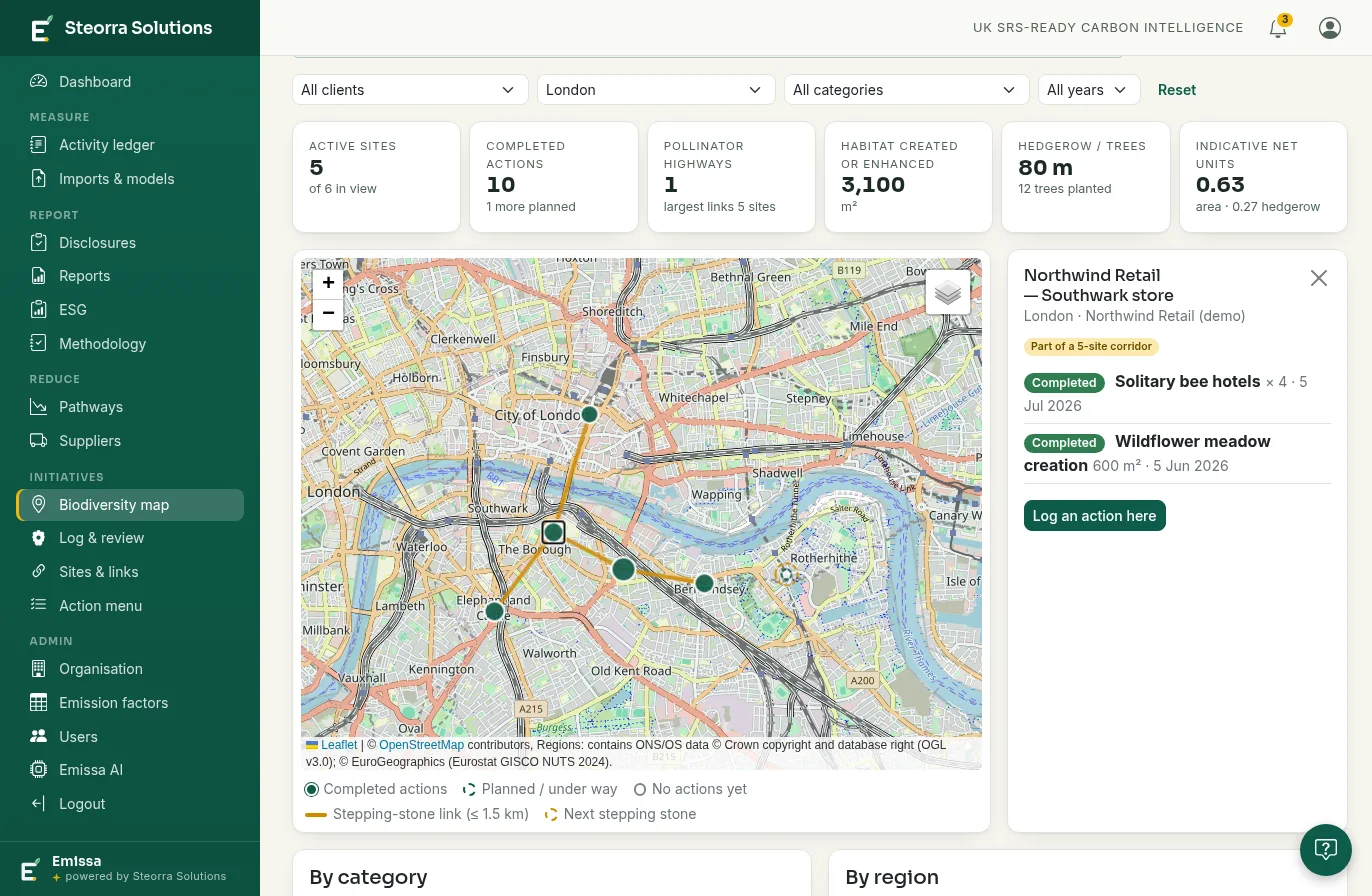
Neighbouring sites, linked
- Sites within a set distance are linked. 1.5 km by default, and yours to change. Each connected group of active sites is a highway.
- The next stepping stones are highlighted: sites close enough that acting there would extend a highway, or join two — counted across every client's sites.
- A "what could we do next" list for each client: the actions each site has not tried yet, stepping stones first — ready for the next account review.
Sites report their own work — you stay in control
From a phone to the map
- A no-login link for every site. Site teams pick the action from a menu informed by the All-Ireland Pollinator Plan, say how much, and add photos from a phone.
- Nothing counts until it is reviewed. Reports wait in a review queue to be accepted, corrected or rejected with a reason; links expire and can be revoked at any time.
- Photos are handled carefully: virus-scanned, with the location data inside them removed before they are stored.
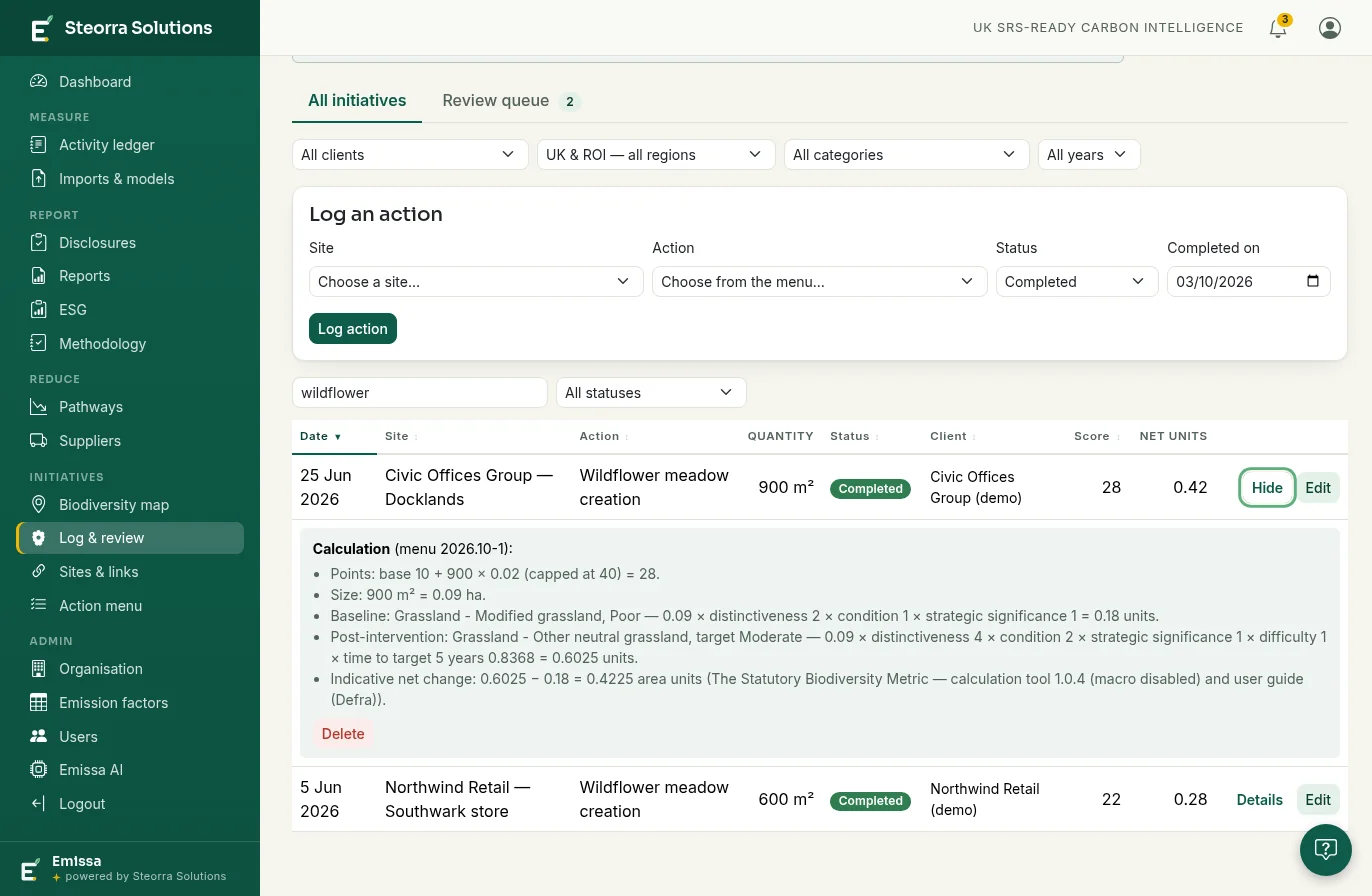
Indicative units, with the working shown
Every action earns engagement points that you weight yourself. Habitat work also shows indicative units: area × distinctiveness × condition, before and after, using the multipliers published in Defra's Statutory Biodiversity Metric — with every multiplier used shown beside the figure.
The units are indicative only. Emissa never presents them as a statutory biodiversity net gain assessment, and no multiplier is invented: the values are copied from Defra's published metric.
Common questions
What is a pollinator highway in Emissa?
Sites with completed habitat or pollinator actions that lie within a set distance of each other — 1.5 km by default, and yours to change — are linked as stepping stones. Each connected group of sites is a highway.
Are the biodiversity units a biodiversity net gain assessment?
No. The units follow the structure and published multipliers of Defra's Statutory Biodiversity Metric but are indicative only. Emissa never presents them as a statutory biodiversity net gain assessment.
Do site teams need an account?
No. Each site gets a no-login link. Site teams pick the action from a menu, say how much, and add photos from a phone. Links expire and can be revoked at any time.
Does a site's report count straight away?
No. Reports wait in a review queue to be accepted, corrected or rejected with a reason. Nothing reaches the totals, the map or a report until someone accepts it.
Which areas does the map cover?
The UK and Ireland: the twelve UK regions and the three Regional Assemblies in the Republic of Ireland. Each site's region is worked out from where it is.
What happens to the photos?
Photos are virus-scanned and the location data inside them is removed before they are stored.
More of the platform
Scope 1 and 2 emissions
Gas, fuel, refrigerant and electricity bills turned into ledger lines, with Scope 2 both location- and market-based.
Scope 3 emissions
All fifteen categories, from supplier data, spend, travel and surveys — with the working on every line.
UK SRS reporting
A disclosure workbook on the four pillars, filled from the ledger, with reports and an audit pack.
Defra conversion factors
Each annual gov.uk release imported automatically and applied to activity dated in its own year.
Carbon audit trail
Every figure walked back to its factor version, calculation trace and source document.
The whole platform
Measure, report and reduce: how the ledger, the methodology statement and the models fit together.
See it with your own data
A demo takes half an hour — bring a handful of real bills and watch them become an auditable ledger.
Book a demo